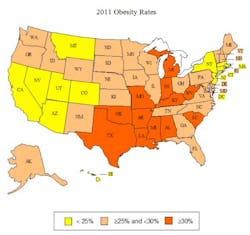
State-by-state adult obesity rates
Obesity has contributed to a dramatic rise in chronic disease rates and health care costs. It is one of the biggest health crises in the country. On a positive note, there is a growing body of evidence that we can help reduce obesity by improving nutrition choices, increasing physical activity, and making healthier lifestyle choices. The bad news is that we are not investing enough in order to reverse the obesity curve and see the returns in terms of health and savings. If states’ obesity rates continue on their current trajectories, the number of new cases of type 2 diabetes, coronary heart disease and stroke, hypertension and arthritis could increase 10 times between 2010 and 2020, and double again by 2030. Obesity could contribute to more than 6 million cases of type 2 diabetes, 5 million cases of coronary heart disease and stroke, and more than 400,000 cases of cancer in the next two decades.

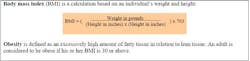
According to the newly released CDC data, part of the 2011 Behavioral Risk Factor Surveillance Survey, the obesity rates by state from highest to lowest were:(1) 1. Mississippi (34.9%); 2. Louisiana (33.4%); 3. West Virginia (32.4%); 4. Alabama (32.0%); 5. Michigan (31.3%); 6. Oklahoma (31.1%); 7. Arkansas (30.9%); 8. (tie) Indiana (30.8%); and South Carolina (30.8%); 10. (tie) Kentucky (30.4%); and Texas (30.4%); 12. Missouri (30.3%); 13. (tie) Kansas (29.6%); and Ohio (29.6%); 15. (tie) Tennessee (29.2%); and Virginia (29.2%); 17. North Carolina (29.1%); 18. Iowa (29.0%); 19. Delaware (28.8%); 20. Pennsylvania (28.6%); 21. Nebraska (28.4%); 22. Maryland (28.3%); 23. South Dakota (28.1%); 24. Georgia (28.0%); 25. (tie) Maine (27.8%); and North Dakota (27.8%); 27. Wisconsin (27.7%); 28. Alaska (27.4%): 29. Illinois (27.1%); 30. Idaho (27.0%); 31. Oregon (26.7%); 32. Florida (26.6%); 33. Washington (26.5%); 34. New Mexico (26.3%); 35. New Hampshire (26.2%); 36. Minnesota (25.7%); 37. (tie) Rhode Island (25.4%); and Vermont (25.4%); 39. Wyoming (25.0%); 40. Arizona (24.7%); 41. Montana (24.6%); 42. (tie) Connecticut (24.5%); Nevada (24.5%); and New York (24.5%); 45. Utah (24.4%); 46. California (23.8%); 47. (tie) District of Columbia (23.7%); and New Jersey (23.7%); 49. Massachusetts (22.7%); 50. Hawaii (21.8%); 51. Colorado (20.7%). Note: 1 = Highest rate of adult obesity, 51 = lowest rate of adult obesity. Individuals with a body mass index (a calculation based on weight and height ratios) of 30 or higher are considered obese.

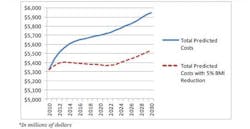
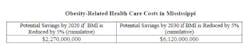
CDC has modernized the methodology for BRFSS this year, setting a new baseline for comparisons. The updated approach, incorporating cell phones and using an iterative proportional fitting data weighting method, means rates are even more reflective of each states’ population, but that the rates were determined in a different way than in the past, making direct change comparisons difficult. The full data set is available.(2)State-By-State Adult Obesity Rate Projections For 2030 Researchers calculated projections using a model published in The Lancet in 2011 and data from the Behavioral Risk Factor Surveillance System, which is an annual phone survey conducted by the CDC and state health departments. The data were adjusted for self-reporting bias. Adults are considered obese if their BMI is 30 or higher. The District of Columbia (D.C.) is included in the rankings because the CDC provides funds to D.C. to conduct a survey in an equivalent way to the states. The full methodology is available in the F as in Fat report.(3) 1. Mississippi (66.7%); 2. Oklahoma (66.4%); 3. Delaware (64.7%); 4. Tennessee (63.4%); 5. South Carolina (62.9%); 6. Alabama (62.6%); 7. Tie Kansas (62.1%); and Louisiana (62.1%); 9. Missouri (61.9%); 10. Arkansas (60.6%); 11. South Dakota (60.4%); 12. West Virginia (60.2%); 13. Kentucky (60.1%); 14. Ohio (59.8%); 15. Michigan (59.4%); 16. (tie) Arizona (58.8%); and Maryland (58.8%); 18. Florida (58.6%); 19. North Carolina (58.0%): 20. New Hampshire (57.7%); 21. Texas (57.2%); 22. North Dakota (57.1%); 23. Nebraska (56.9%); 24. Pennsylvania (56.7%); 25. Wyoming (56.6%); 26. Wisconsin (56.3%); 27. Indiana (56.0%); 28. Washington (55.5%); 29. Maine (55.2%): 30. Minnesota (54.7%); 31. Iowa (54.4%); 32. New Mexico (54.2%); 33. Rhode Island (53.8%); 34. Illinois (53.7%); 35. (tie) Georgia (53.6%); and Montana (53.6%); 37. Idaho (53.0%); 38. Hawaii (51.8%); 39. New York (50.9%); 40. Virginia (49.7%); 41. Nevada (49.6%); 42. Oregon (48.8%); 43. Massachusetts (48.7%); 44. New Jersey (48.6%); 45. Vermont (47.7%); 46. California (46.6%); 47. Connecticut (46.5%); 48. Utah (46.4%); 49. Alaska (45.6%); 50. Colorado (44.8%); 51. District of Columbia (32.6%). Note: 1 = Highest rate of adult obesity, 51 = lowest rate of adult obesity. State-By-State Potential Health Care Cost Savings By 2030 If States Reduce Average Body Mass Index By 5 Percent 1. California ($81,702,000,000); 2. Texas ($54,194,000,000); 3. New York ($40,017,000,000); 4. Florida ($34,436,000,000); 5. Illinois ($28,185,000,000); 6. Ohio ($26,328,000,000); 7. Pennsylvania ($24,498,000,000); 8. Michigan ($24,187,000,000); 9. Georgia ($22,743,000,000); 10. North Carolina ($21,101,000,000); 11. Virginia ($18,114,000,000); 12. Washington ($14,729,000,000); 13. Massachusetts ($14,055,000,000); 14. Maryland ($13,836,000,000); 15. Tennessee ($13,827,000,000); 16. Arizona ($13,642,000,000); 17. Indiana ($13,400,000,000); 18. Missouri ($13,368,000,000); 19. Wisconsin ($11,962,000,000); 20. Minnesota ($11,630,000,000); 21. Colorado ($10,794,000,000); 22. Louisiana ($9,839,000,000); 23. Alabama ($9,481,000,000); 24. Kentucky ($9,437,000,000); 25. South Carolina ($9,309,000,000); 26. Oregon ($7,938,000,000); 27. Oklahoma ($7,444,000,000); 28. Connecticut ($7,370,000,000); 29. Mississippi ($6,120,000,000); 30. Arkansas ($6,054,000,000); 31. Kansas ($5,979,000,000); 32. Nevada ($5,921,000,000); 33. Utah ($5,843,000,000); 34. Iowa ($5,702,000,000); 35. New Mexico ($4,095,000,000); 36. Nebraska ($3,686,000,000); 37. West Virginia ($3,638,000,000); 38. Idaho ($3,280,000,000); 39. New Hampshire ($3,257,000,000); 40. Maine ($2,870,000,000); 41. Hawaii ($2,704,000,000); 42. Rhode Island ($2,478,000,000); 43. Montana ($1,939,000,000); 44. Delaware ($1,912,000,000); 45. South Dakota ($1,553,000,000); 46. Alaska ($1,530,000,000); 47. New Jersey ($1,391,000,000); 48. Vermont ($1,376,000,000); 49. North Dakota ($1,177,000,000); 50. Wyoming ($1,088,000,000); 51. District of Columbia ($1,026,000,000). “Bending the Obesity Curve” is available for all states.(4) An example here represents Mississippi, with the highest rate of obesity in the country. Reducing the average body mass index in the state by 5 percent could lead to health care savings of more than $2 billion in 10 years and $6 billion in 20 years.Projections for Annual Obesity-Related Health Spending in Mississippi, 2010-2030
Due to expected increases in obesity, the projected baseline estimates for: The number of new cases of diabetes could be 7.9 million (+/- 1.6 million) per year, which means it could be as low as 6.3 million or as high as 9.5 million; The number of new cases of chronic heart disease and stroke could be 6.8 million (+/- 1.5 million) per year, which means it could be as low as 5.3 million or as high as 8.3 million; The number of new cases of cancer could be 500,000 (+/- 0.1 million) per year, which means it could be as low as 400,000 or as high as 600,000.(5)Effective Ways to Reduce Obesity According to the U.S. Centers for Disease Control and Prevention (CDC), more than half of all Americans live with a preventable chronic disease, and many such diseases are related to obesity, poor nutrition and physical inactivity.(6) A wide range of studies have found that effective disease-prevention programs in communities can improve nutrition, increase physical activity and reduce obesity rates. The CDC’s Community Preventive Services Taskforce conducts a systematic review and evaluation process to determine effective programs and policies for improving health and preventing disease. The results, published in the Community Guide for Preventive Services, feature a series of evidence-based, community approaches to increasing physical activity, promoting good nutrition, lowering diabetes rates and reducing obesity. The approaches include improving the built environment by building sidewalks and increasing access to parks; starting workplace wellness programs; and increasing physical activity in schools.(7) The Compendium of Proven Community-Based Prevention Programs by The New York Academy of Medicine (NYAM) includes a summary and examples from an extensive literature review that NYAM conducted of peer-reviewed studies evaluating the effectiveness of community-based disease-prevention programs.(8) NYAM identified 84 articles, including programs that can directly reduce obesity and obesity-related diseases. In 2011, the American Heart Association (AHA) published a review of more than 200 studies and concluded that most cardiovascular disease can be prevented or at least delayed until old age through a combination of direct medical care and community-based prevention programs and policies.(9) Some of the key findings included: Every $1 spent on building biking trails and walking paths could save approximately $3 in medical expenses; For every $1 spent in wellness programs, companies could save $3.27 in medical costs and $2.73 in absenteeism costs; Some interventions have been shown to help improve nutrition and activity habits in just one year and had a return of $1.17 for every $1 spent; Participants in community-based programs who focused on improving nutrition and increasing physical activity had a 58 percent reduction in incidence of type 2 diabetes compared with drug therapy, which had a 31 percent reduction.(10)
References 1. www.healthyamericans.org, Appendix C. 2. http://www.cdc.gov/brfss/technical_infodata/surveydata/2011.htm. 3. http://healthyamericans.org/report/100/. 4. State_Cost_Curve_Pages_FINAL. 5. Note: Hypertension and arthritis were not included in The Lancet study, but were included in the state-by-state analysis. Potential new cases of hypertension and arthritis were calculated using the same process as used for diabetes, chronic heart disease and stroke and cancer. 6. Kung HC, Hoyert DL, Xu JQ, and Murphy SL. Deaths: final data for 2005. National Vital Statistics Reports 2008. Atlanta, GA: Centers for Disease Control and Prevention, 2008. http://www.cdc.gov/nchs/data/nvsr/nvsr56/nvsr56_10.pdf. 7. Community Guide to Preventive Services. U.S. Centers for Disease Control and Prevention, 2011. http://www.thecommunityguide.org/index.html. 8. A Compendium of Proven Community-Based Prevention Programs. New York, NY: The New York Academy of Medicine, 2009. 9. Weintrub WS et al. AHA Policy Statement: Value of Primordial and Primary Prevention for Cardiovascular Disease. Circulation, 124: 967-990, 2011. 10. Busko M. “As treatment costs soar, AHA preaches prevention as savvy investment.” Heartwire July 26, 2011. http://www.theheart.org/article/1256761.do.

Maria Perno Goldie, RDH, MS
To read previous RDH eVillage FOCUS articles by Maria Perno Goldie, go to articles.