July Data Bite: Here's the national average for case acceptance
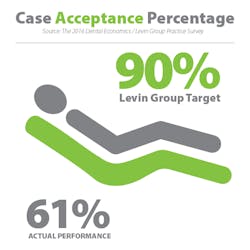
Dentists, here is the percentage of patients who accepted treatment in 2015–2016. How does your practice stack up?
Dentists, are you leaving production in the chair? Here is the target we give our dental practices, and here is the number dentists reported in our 2016 Dental Economics–Levin Group Annual Practice Survey
Analysis
Case acceptance represents one of the best growth opportunities for dental practices. Yet, it’s an area that most dentists struggle with for several reasons:
- Discomfort—Dentists out of their element “selling” dentistry to patients
- Too much work—Larger cases and elective treatment usually require multiple, involved presentations
- Built-in bias—A belief that many patients won’t accept a certain type of treatment, so why present it?
According to the 2016 Dental Economics / Levin Group Practice Survey, dentists are only persuading patients to move forward with treatment 61% of the time. What’s disturbing about this number—30 percentage points below the target we train our consulting clients to attain—is that it includes treatment for caries, which is typically in the 95% to 100% acceptance range.
If caries is removed from this statistic, what then are the acceptance percentages for elective treatment and larger cases?
Conclusion
Look at your own practice. During case presentations, do you emphasize the benefits or just the process of treatment? Are you presenting comprehensive care to every patient, or do you focus mainly on single-tooth treatment? Do you use scripts to stay on point? Your answers to these questions will help you make changes to your case presentation process and move closer to the 90% target.
Look for the full analysis of this year’s Dental Economics / Levin Group Annual Practice Survey in the September issue of Dental Economics.
Arrange for Dr. Levin to present a seminar to your study club or association. A leading expert in practice management and marketing, he’s also one of the most dynamic speakers in dentistry. For details, contact our Seminar Events Manager Rebecca Luwisher at [email protected] or (443) 471-3202.
Editor's note: This article originally appeared in the DentistryIQ–Apex360 weekly newsletter. You can subscribe here.
CATCH UP ON PAST DATA BITES
The 2 biggest obstacles to practice success
The 4 best things about being a dentist in 2015 (according to dentists)
What expert advisors do dentists rely on?
Dental practices should follow the trend in elective treatment
Longer workweek and later retirement for dentists, new research shows
58% of practices don't use phone scripts
Do you have the necessary business skills?
Dentists anticipate postponing retirement
38% of dentists 'highly or extremely stressed'—analysis and solution from Levin
Why are only 27% of practices asking for referrals?
Practice collections climb to 94.3% in 2014
Dentists, you're still too stressed out
Dentists, update your Facebook page!
Autonomy is #1 again
For the most current dental headlines, click here.
About the Author

Roger P. Levin, DDS
CEO and Founder, Levin Group
Roger P. Levin, DDS, is the CEO of Levin Group, a leading dental management consulting firm. Founded in 1985, Levin Group has worked with over 30,000 dental practices. Dr. Levin is a sought-after speakers in dentistry and is a leading authority on dental practice success and sustainable growth. Through extensive research and cutting-edge innovation, Dr. Levin is a recognized expert on propelling practices into the top 10%. He has authored 65 books and over 4,000 articles on dental practice management and marketing.
Dr. Levin sits on the editorial board of five dental publications and has been named as one of the Leaders in Dentistry by Dentistry Today magazine for the last 15 years. He was recently named one of the 32 Most Influential People in Dentistry by Incisal Edge magazine and voted Best Dental Consultant by the readers of Drbicuspid.com. He has been featured in the Wall Street Journal, New York Times, and Time magazine, and is the creator of the Levin Group Tip of the Day,which has over 30,000 subscribers.
To contact Dr. Levin, visit levingroup.com or email [email protected].
Updated March 7, 2019


