Dental production index now available
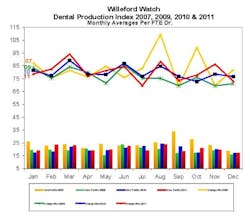
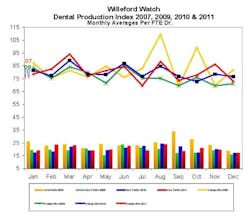
The Willeford Group offers its Dental Production Index for 2007, 2009, 2010, and 2011. Statistics show what your doctor production level could have been. The difference between that and your actual number tells you how much higher your cash flow could have been if your practice was running at optimum efficiency.
Some details from the report ...
- December’s production per doctor was $73,000.
- On average, doctors worked 14 days in December or produced about $5,200 per day.
What was your production? If your office produced only $4,200 per day and worked 14 days, then you could have produced $1,000 more per day, meaning an additional $14,000 could have been produced in your office in December. You could have kept an average of $12,500 net profit. If this happens every month, then an additional $150,000 per year could go into your pocket.Do you have room for improvement? Click here for more information. You may also contact Rick Willeford at [email protected] or Kate Willeford at [email protected]. Note: The Dental Production Index tracks practice trends per doctor for the same set of practices over four years, so the results are comparable. These are all stable, predominantly fee-for-service, general practices open for five years or more.

