The 5 metrics every dental practice should be tracking

Dentists constantly assess the overall health of their patients. To do this, they use a variety of methods, technologies, and established procedures to diagnose and treat patients. They also draw upon their previous experiences with each and every patient when determining what each patient needs.
This mental “database” is unique to each dentist and is a critical part of their ability to provide treatment and healing. In a similar way to how dentists call upon all of their expertise and resources for patient care, there are also important metrics, procedures, principles, and tools that can help assess the health of their practices. Not only can these key performance indicators (KPIs) help diagnose what’s happening in a practice, these metrics can also be used to help improve the health of a practice.
My team works with thousands of providers around the country. We frequently hear some variation of the following question: “How can I keep a pulse on my practice?” This is an excellent question, and it reflects the commitment these providers have to improving their dental practices. This is often asked with some frustration and sometimes anger. Clearly this is something these professionals have been trying to figure out for some time, but without success. In spite of investing significant expense, energy, and effort into understanding which metrics matter and why, many of these providers are still searching for answers.
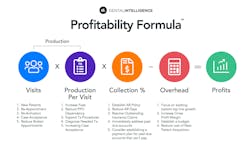
This article addresses a few of the many elements found in my team’s “Profitability Formula” (figure 1). My goal is to help you think about where your practice is today, what steps you can take to improve, and inspire you to take action. In his best-selling book The Seven Habits of Highly Effective People, Dr. Stephen R. Covey shares a story about teaching one of his children the importance of taking ownership of their responsibilities. He referred to this experience, which involved caring for their lawn, as “green and clean.” We use this phrase here at Dental Intelligence when we talk about practice teams becoming “owners” of their KPIs. What is “green and clean” to you, to your team, to your practice?
Here are the five metrics, based on our Profitability Formula, that every practice should be tracking.
Annual patient value: Are you increasing the value of your patients? Annual Patient Value (APV) is determined by calculating collections per patient for all active patients. If APV is increasing, it’s a great sign that you’re increasing the value of your patients, meaning they’re receiving more of the treatment they need. Determining APV gets rid of a lot of the “fluff” around gross production. Knowing the annual value of each patient helps you accurately answer questions such as, “Is my practice healthy?” “What am I collecting per active patient?” “Are we seeing our patients enough?” and others. APV is an important lagging indicator. If you look at this compared to Production Per Visit (PPV), you can see deeper into the health of your practice. For example, if your APV was $600 and your PPV was $325, this means you’re seeing your patients two times annually at most, which indicates there is likely a lot of unscheduled treatment and production sitting in your practice management software. This is a good metric for determining the health of the practice and relates directly to the next two metrics you should be tracking.
Preappointment percentage: This metric is determined by looking at your active patient base to learn how many of them have a future appointment. This tells you whether or not you’re getting new patients, recurring patients, etc. as well as how many of them have scheduled a next appointment. This greatly impacts visits because if your preappointment percentage is low (<30–40%), it means a lot of your active patients are not returning, meaning you’re not using patient visits as well as you could be and thus your ability to increase production and visits is diminished.
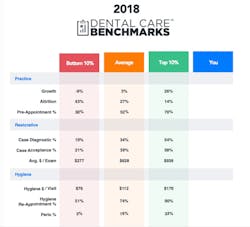
Production per visit (PPV): This is one of the top metrics. PPV helps identify how much and what kind of treatment you’re providing. Are you decreasing, are you seeing lulls, are you seeing cyclical patterns? I recently received an email from a dentist and dental study group leader in Pennsylvania asking for industry benchmarks (figure 2) to help the many dentists he works with understand why they’re seeing a decrease in production. Measuring PPV lets you see if the volume of patients is decreasing or if this is caused by patients accepting less treatment. It also helps you identify at what rate you are getting acceptance of treatment and helps you see how you’re doing in overall treatment in relation to your patients.
Hygiene reappointment percentage: How are you doing daily in reappointing patients who came in for hygiene? How did you do yesterday with getting your patients back in the practice, scheduled for hygiene? This also impacts annual value.
Periodontal treatment percentage: This helps you see from a preventive side how you’re doing as a whole, which drives production per visit. Are you increasing the amount of hygiene care you’re providing? This also drives hygiene production per visit. If you’re not finding perio-related opportunities, are you finding restorative production? How are your hygienists doing in codiagnosing this type of treatment?
Once you start tracking and understanding these five metrics, you can start drilling down into your case metrics, such as treatment dollar acceptance percentage, patient acceptance, and patient diagnostic percentage. These are the hardest KPIs to change but will also provide you with the clearest window into the health of your practice. Once you have a firm grip on these metrics, you can start delegating responsibility to different team members to take ownership of the different metrics—“green and clean!” For example, your hygienists should be at a periodontal treatment percentage of 35% or better. Your front desk should be at $850 annual value per patient, etc.
So, if there was one metric you should start with, it would be production per visit. Where are you currently on PPV? Calculate this for each month. Figure out where you are and begin building from there. Be sure to calculate for this year and last year. Where do you think you should be? Where do you want to be? The benchmarks in figure 2 can help you compare. Are you where you want to be, and if not, do you know what to do to get to where you want to be?
Metrics help you correlate your data with personal and team member behaviors. This then gets you to your case metrics, which can vary day to day depending on the patients who come in and how healthy their teeth are. But it’s still a wide open window into patient health and practice performance.
Once you know where you are, you can begin setting goals to impact your production per visit, which will drive your annual patient value. Exciting growth is almost guaranteed to happen. What’s your “green and clean?”
Christopher Toyn is vice president of finance at Dental Intelligence. He can be contacted at [email protected].
About the Author
Christopher Toyn
Christopher Toyn is the vice president of finance at Dental Intelligence. Contact him at [email protected].