The 7 revenue cycle gaps most dental practices don’t know they have
Key Highlights
- Look beyond collections: Adjusted collection rate, clean claims rate, denial rate, and AR aging can reveal revenue leakage hidden by standard reporting.
- Address seven revenue gaps: Coding errors, abandoned claims, fee schedule drift, credentialing delays, and other process failures can prevent earned production from becoming collected revenue.
- Treat RCM as a leadership priority: Establishing benchmarks and quantifying the dollar impact of each gap can turn vague collection concerns into a focused revenue improvement strategy.

Most dental practices believe their revenue cycle is functioning well because their collections appear healthy ... but they are measuring the wrong number.
The gap between what a dental practice produces and what it actually collects, and the gap between what it collects and what it was entitled to collect, is almost always predictable. It follows patterns driven by specific process failures that are consistent across practices of every size, structure, and ownership model. The challenge is that these gaps are largely invisible in standard reporting because standard reporting isn't designed to shine a light on them.
Here are the seven revenue cycle gaps that most dental practices don't know they have, and what each one is costing the practice.
Gap 1: The adjusted collection rate confusion
Most practices track their gross collection rate, which is the total collections divided by gross production. While often highly regarded, this number is nearly meaningless for practice management because it includes contractual write-offs that were never legitimate revenue to begin with.
The metric that matters is the adjusted collection rate, which is the total collections divided by net production after removing contractual adjustments negotiated with insurance payors. The adjusted collection rate tells you what percentage of the revenue the practice was legitimately entitled to collect that it actually collected.
The benchmark: Adjusted collection rate should be 98% or above. Anything below 95% indicates systemic collections failures.
Most practices that believe they are collecting "around 95%" of production are measuring gross collections. Their actual adjusted collection rate is often 88%–92%, meaning they are permanently losing six to 10 cents of every earned dollar.
The fix begins with recalculating. Pull the net production numbers—gross production minus contractual adjustments—and divide total collections by that number. The gap between that figure and 98% is the annual revenue opportunity. On a practice with $2M in net annual production, a six-point gap represents $120,000 in revenue that should have been collected and wasn't.
For practices and DSOs reviewing this metric, the cadence matters as much as the number. Adjusted collection rate should be reviewed monthly by payor—not in aggregate—and aligned with state-specific prompt-pay legislation, which establishes the timeline within which payors are legally required to process clean claims. Payor-level review catches deterioration that aggregate metrics mask until it has compounded into material accounts receivable (AR) problems.
Gap 2: The coding layer—production that never becomes a claim
This is the gap that standard revenue cycle management (RCM) metrics are structurally unable to see, because standard RCM metrics only measure what enters the claims process. They have no visibility into what should have entered it and didn't.
The coding layer problem has two distinct forms:
- Production coded to nonbillable internal codes. Many practices use internal tracking codes to document clinical observations or patient notes alongside billable CDT procedures. When these internal codes are used without a corresponding billable CDT code being separately submitted, clinical work gets documented without becoming revenue. Practices that have conducted systematic production-to-claim reconciliations consistently find 5%–15% of documented clinical production did not generate a corresponding claim.
- Abandoned claims in the too-hard basket. Claims that were submitted, denied, and then never followed up don't technically disappear from AR aging reports, but they effectively do. They get deprioritized below the current denials queue and sit aging quietly while the billing team focuses on what's active and immediately recoverable. Out of sight, out of mind—until the payor's timely filing deadline passes, and the claim becomes permanently uncollectable. The AR aging report continues to look acceptable because the abandoned claims are still technically on the books, showing in the 90-day and 120-day buckets until they are written off.
Practices that conduct forensic work on historical abandoned claims consistently find recoverable dollars that standard RCM metrics never flagged. The aggregate AR aging number looked acceptable. The underlying composition told a different story.
The diagnostic tool: A production-to-claim reconciliation, a systematic comparison of clinical production documented in the practice management system against claims submitted, surfaces both problems in specific dollar terms. It requires pulling data from multiple sources at a level of granularity most practices don't maintain as routine reporting.
Gap 3: The denial acceptance problem
Insurance claims get denied and in many dental practices, those denials are accepted as final.
The industry benchmark denial rate across all denial types is 4% or below. Most payors flag practices for payment integrity review when denial rates exceed 8%. Most practices operate with denial rates between 8% and 15%. According to Premier's 2024 survey,1 54% of denied claims were ultimately paid after provider resubmission, but an average of three resubmission cycles were required, each taking 45 to 60 days. At that cadence, pursuing a denied claim to payment takes four to six months and significant staff time. Most billing teams don't have that bandwidth. The claim goes in the too-hard basket, and the revenue disappears.
What denial acceptance costs: A practice billing $150,000 per month in insurance claims, at a 10% denial rate, has $15,000 in claims denied monthly. Even assuming only 60% of denials are pursued and overturned—a conservative operational target—that's $9,000 per month, or $108,000 annually, in recoverable revenue being permanently written off.
The reason denials are accepted rather than appealed is almost never that they are unwinnable. It is that no one owns the appeal process. Denials arrive, are logged, and age until they are written off. The fix is structural: every denial requires a named owner, an appeal filed within five business days of receipt, and a tracking system that measures resolution rates by payor and denial reason code.
Categorizing denials by reason code is the starting point. Most practices find that 70%–80% of their denial volume comes from five or fewer reason codes, which means the remediation is targeted rather than comprehensive.
Gap 4: The clean claims rate problem—upstream, not downstream
Clean claims rate—the percentage of insurance claims submitted correctly on the first pass—is one of the most powerful revenue cycle metrics, because it reveals a problem that has its root upstream from the billing function.
The benchmark: Clean claims rate should be above 98%. Below 90% means more than 10% of all claims require rework before they generate payment.
Claims are denied or rejected because of documentation errors, missing pre-authorization, incorrect procedure codes, or eligibility verification failures. These errors occur at the point of care, in the clinical note, in the scheduling workflow, in the front desk eligibility check—not in the billing department.
Three upstream process changes generate the highest clean claims rate improvements: eligibility verification completed 24 to 48 hours before every appointment rather than at check-in; a clinical documentation review against the top denial reason codes to identify patterns that consistently trigger denials; and a presubmission claim scrubber that catches common errors before submission.
Treating clean claims rate as a billing department metric, rather than a clinical and operational metric, is why most improvement efforts underperform. The billing team can only work with what the clinical team documents.
There is also a coding pattern dimension that clean claims rate doesn't capture. A 93% clean claims rate on a coding pattern carrying significant exposure across multiple CDT procedure families is not a strength—it is a risk that hasn't been triggered yet. Payors pay clean claims first and conduct payment integrity audits of coding patterns later. The recoupment letter typically arrives 12 to 24 months after the coding pattern established itself. A code-level scrub, a review of CDT code distribution, and procedure family frequency against payor benchmarks is the diagnostic that surfaces this exposure before it materializes.
Gap 5: The AR aging blind spot
Accounts receivable aging is one of the most important leading indicators of revenue cycle health, and one of the most consistently misread.
Most practices look at total AR and total collections and conclude that AR is under control. The metric that reveals the problem is AR aging distribution—specifically, what percentage of total insurance AR is over 90 days old.
The benchmark: Insurance AR over 90 days should be below 20% of total insurance AR.
In practice, it is common to find insurance AR over 90 days, representing 35%–50% of total insurance AR. In those buckets, a significant proportion is approaching or past the payor's timely filing deadline. Once a claim has passed timely filing, no amount of follow-up will generate payment. That revenue is permanently gone—and it doesn't show up as a problem in aggregate AR metrics until the write-off occurs.
The fix is a structured AR follow-up cadence that escalates by age—not a passive reminder system, but an active process with specific follow-up actions at 30, 60, and 90 days. Claims approaching payor timely filing limits need a priority flag that pulls them out of the general queue for immediate action regardless of dollar amount.
Gap 6: The fee schedule drift problem
Contracted rates negotiated at initial payor contract signing, and then never revisited, erode in real value every year as market rates increase while contracted rates don't. Most practices have no systematic mechanism to identify where the gaps are or how large they've become.
FairHealth provides publicly accessible contracted rate benchmark data by CDT code, payor, and geography. Comparing contracted rates against FairHealth percentile benchmarks makes the specific gaps visible—not as a general request for higher rates, but as a data-supported conversation about specific codes where contracted rates are demonstrably below market.
What this looks like in practice: The following represents FairHealth benchmark data for Washington State—illustrative of the type of analysis any practice can run for their state and payor mix. The pattern of concentrated gaps in high-volume procedure codes is consistent nationally.
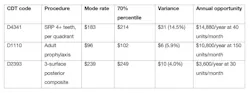
The D4341 finding is the most significant in this dataset, and the most consistent pattern across markets nationally. Scaling and root planing reimbursement is one of the most commonly negotiated procedure categories, and contracted rates frequently lag FairHealth 70th percentile benchmarks by 10%–20%. At 40 quadrants per month, closing a $31 gap to the 70th percentile generates nearly $15,000 per year in additional revenue from one procedure code, with no additional cost.
Importantly, this exercise doesn't always reveal gaps. In this same Washington State dataset, evaluation codes (D0140, D0150, D0330), composite restorations (D2391, D2392), and implant placement (D6010) all showed modes at or above the FairHealth 70th percentile, meaning contracted rates for those codes are already competitive. The value of the benchmarking exercise is in identifying the specific codes where rates have drifted below market, not in assuming all codes have gaps.
Combined, the three codes showing gaps above represent $29,280 per year in foregone revenue at conservative procedure volumes from fee schedule drift alone, without adding a single patient or clinical hour.
The negotiation that produces results: The highest-ROI fee schedule negotiations prioritize payor-code combinations by volume times rate gap, the procedures billed most frequently where the contracted rate is most below benchmark. A 10% rate improvement on a code billed 150 times per month generates 10 times the financial impact of the same improvement on a code billed 15 times per month.
One contractual term worth securing in every renegotiation: annual escalator language. Contracts without built-in escalators require active renegotiation to keep rates current. Contracts with CPI-linked or fixed-percentage annual escalators maintain their market position without requiring the same ongoing management attention.
Gap 7: The credentialing revenue gap
Credentialing is almost universally treated as an administrative function. It is a revenue function, and the gap between how most practices manage it and best practice is measurable in significant annual revenue.
Every day a provider is not credentialed with an insurance payor is a day of insurance revenue that cannot be collected from that payor. Permanently. The revenue from those days can rarely be retroactively billed once credentialing is complete.
The numbers: At $1,500 per day in insurance revenue per full-time provider—a 70-day credentialing gap, which is typical—best practice is 30 days, representing $105,000 in permanently foregone revenue per provider. Across a DSO adding 10 providers annually, that gap compounds into over $1M in systematic annual revenue loss from credentialing alone.
The fix has two components: The first is beginning the credentialing application at the moment of employment offer, not after the provider's first clinical day, with a defined 30-day completion target managed either by a dedicated internal function or a third-party vendor with a contractual SLA.
The second is recredentialing management. Every active credential requires renewal, typically every two years. A group with 20 providers has approximately 10 recredentialing events per year. Lapsed credentials create the same revenue interruption as initial credentialing delays and are entirely preventable with a tracking calendar. Most groups that manage initial credentialing well have no system for recredentialing and discover the lapse only when a claim is denied for inactive credentials.
The compound effect
These seven gaps do not operate independently. A practice with a 91% adjusted collection rate, a 12% denial rate, 40% of insurance AR over 90 days, an unchecked coding layer, an 85% clean claims rate, below-market contracted rates on high-volume procedure codes, and 70-day average credentialing time is not facing seven separate problems. It is facing a revenue cycle infrastructure problem that creates compounding revenue loss across every dimension simultaneously.
The starting point for any revenue cycle improvement initiative is establishing the baseline: calculating current performance against each benchmark and quantifying the specific dollar gap between current performance and target. That quantification converts a vague sense that "collections could be better" into a specific improvement agenda with a clear financial return attached to each initiative.
The practices and DSOs that close these gaps most successfully share one characteristic: they treat revenue cycle performance as a leadership priority rather than an administrative function. When adjusted collection rate, denial rate, AR aging distribution, and clean claims rate are reviewed at the practice or group leadership level monthly—with the same rigor applied to production and scheduling—the gaps close faster and stay closed longer.
The revenue cycle is the mechanism through which clinical excellence translates into the financial health that sustains a practice. Managing it with the same discipline applied to patient care is the hallmark of the highest-performing dental organizations.
What these gaps cost at DSO scale
The gaps above are practice-level problems. At DSO scale, they become enterprise value problems.
A conservative 10-location general dental DSO—$15M in annual net production, $1.5M per month in insurance billing, eight new providers hired annually—faces the following combined opportunity across the four quantifiable gap categories:
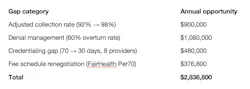
At current dental platform multiples of 7x to 10x adjusted EBITDA, that $2.84M in recoverable annual revenue represents between $19.9M and $28.4M in enterprise value from process improvements in four categories, without adding a single location, patient, or clinical hour.
Two categories not included above add materially to the total for DSOs that pursue them. A 5%–10% production-to-claim conversion gap on $15M in net production represents $750,000 to $1.5M in additional annual opportunity. Renegotiating fee schedules to the 80th percentile rather than the 70th adds $242,400 to the fee schedule category alone.
The compound effect applies at scale as it does at the practice level. These gaps don't operate independently, and each location added to a platform with unaddressed RCM infrastructure problems multiplies the revenue leakage proportionally.
The practices and DSOs that close these gaps before going to market command premium multiples. The ones that don't discover them in due diligence—priced into deal structure rather than captured as value.
Reference
- Alkire MJ, Saha S, Ingram M. Trend alert: private payers retain profits by refusing or delaying legitimate medical claims. Premier. March 21, 2024. https://premierinc.com/newsroom/blog/trend-alert-private-payers-retain-profits-by-refusing-or-delaying-legitimate-medical-claims
About the Author
 Hendrik Lai, BDS, DBA(hc), ChMC, MBA, EMBA, MS, FIDM, CM
Hendrik Lai, BDS, DBA(hc), ChMC, MBA, EMBA, MS, FIDM, CM
Hendrik Lai, BDS, DBA(hc), ChMC, MBA, EMBA, MS, FIDM, CM, is the managing partner of Viturtal Consulting, a boutique dental consulting firm advising dental practices, DSOs, and private equity sponsors on operational execution, revenue cycle improvement, and value creation. He serves on the DentistryIQ Editorial Advisory Board. Learn more at viturtal.com.